
To be successful in investment, investors need to be able to analyse stocks to make the right investment decisions by choosing to invest in stocks that are likely to increase price in the future. Two types of analysis that are commonly used in financial markets are fundamental analysis and technical analysis. This article will focus on technical analysis.
What is Technical Analysis?
Technical Analysis is a method of evaluating a stock’s future potential performance based on historical data, primarily price and trading volume. This method aims to identify trends, patterns and signals that can help investors predict future price movements. Technical Analysists use charts and technical indicators to analyse optimal entry and exit points for trades.
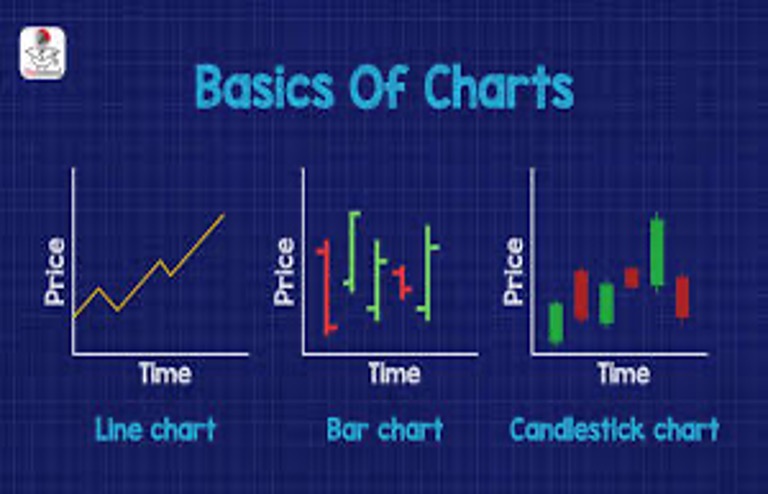
One of the main tools in Technical Analysis is the stock market chart which shows historical price and volume data and categorized into different types such as:
1. Line chart: displays closing prices over a specific period of time, providing a simplified and useful view of the trend.
2. Bar charts: shows open, high, low and close prices, offering more detail than a line chart.
3. Candlestick chart: presents the same data as a bar chart but in candlestick format, highlighting price movements and trend reversals.
In addition to charts, technical analysts use a wide range of indicators to predict future price movements. Commonly used indicators in the Cambodian stock market include:
1. Moving averages: identifies both short-term and long-term trends by smoothing out rapid daily fluctuations (zigzags).
2. Relative strength index: measures the strength of price movements to indicate overbought or oversold conditions.
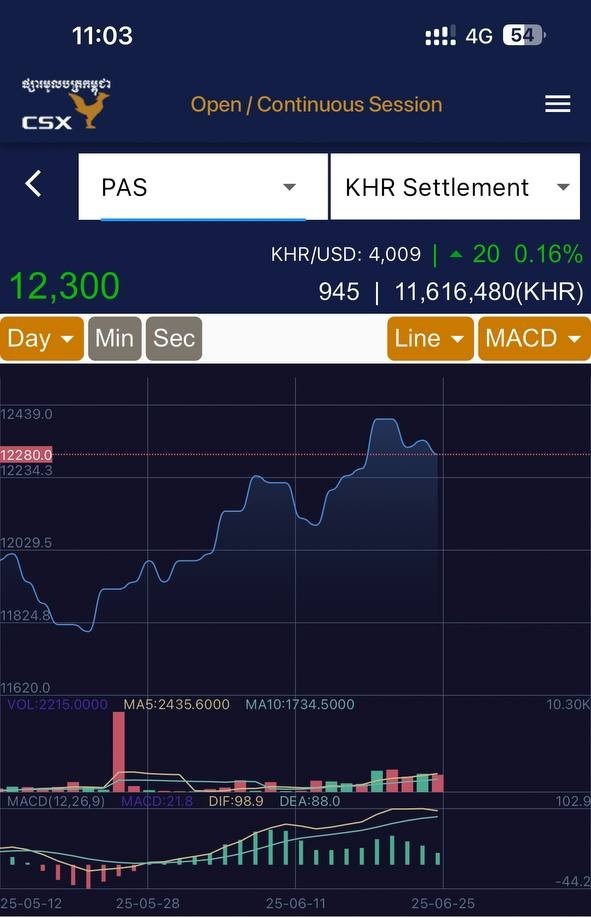
3. Moving average convergence divergence: helps identify trend reversals and potential buy or sell signals.
In addition, there are several elements of technical analysis used to evaluate securities, such as:
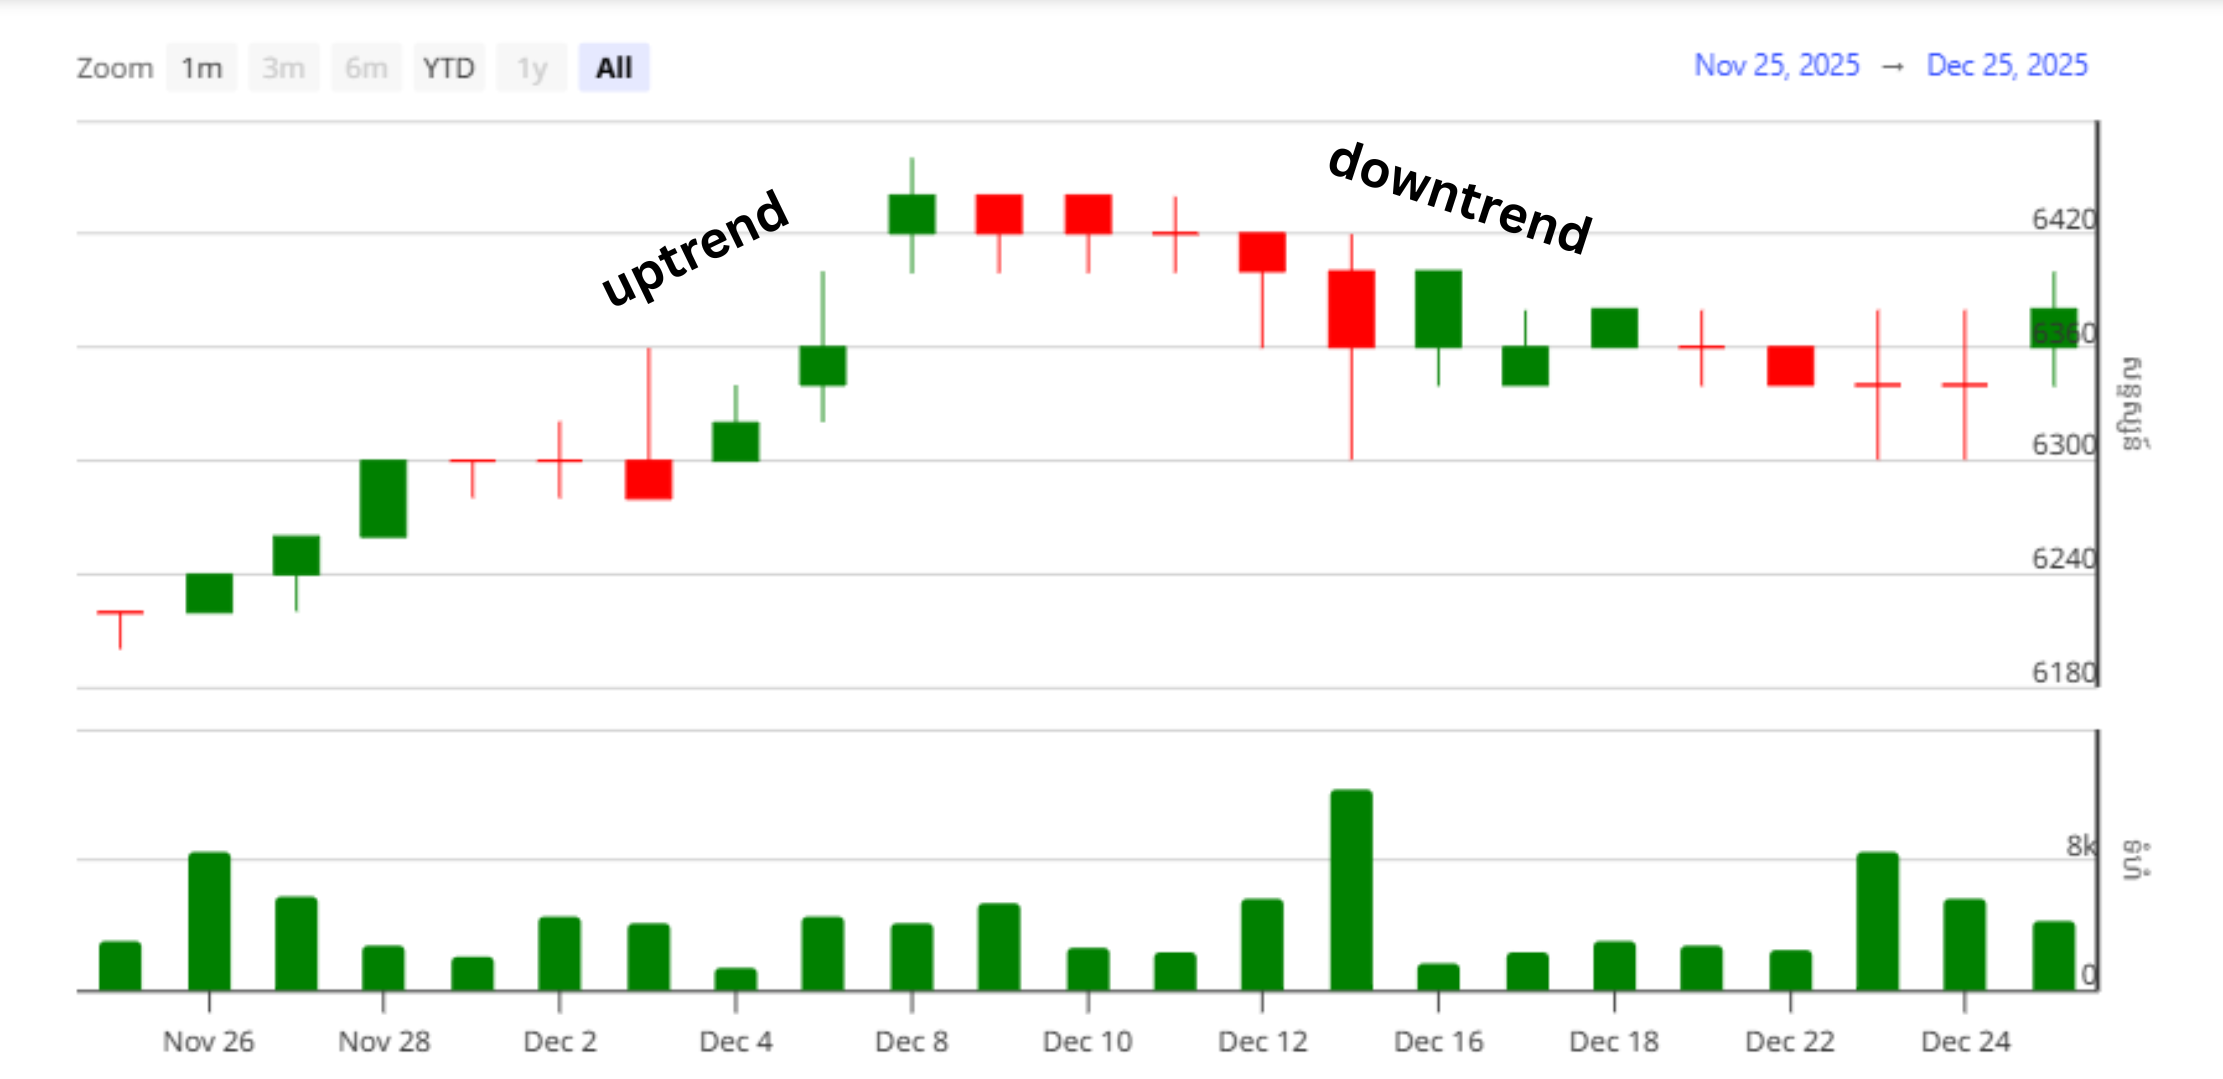
1. Trend lines: a basic tool representing the direction and strength of a price trend.
- In an uptrend, the trend line is drawn below the price, connecting higher lows.
- In a downtrend, the trend line is drawn above the price, connecting lower highs.
2. Support and resistance levels: critical concepts in Technical Analysis.
- Support: a price level that buying tends to emerges, preventing further declines.
- Resistance: a price level that selling tends to appear, preventing the stock from rising higher.
3. Trading volume: indicates the number of shares or contracts traded during a given period of time.
- Rising volume often signals significant price movements.
- Declining volume may indicate weakening momentum in a trend.
Method of using technical analysis:
Technical Analysis plays a vital role in the securities market by helping traders and investors make decisions. It is particularly useful for short-term traders who seek to profit from price fluctuations. Technical Analysts focus on: 1. Analysing price and trading volume data, 2. Assessing supply and demand forces to determine future direction or trend and 3. Studying charst, technical indicators and oscillators (high and low fluctuations) to make buy or sell decisions.
Core assumptions of technical analysis
1. The market discounts everything: this assumes focuses only on price movement base on the belief that company’s fundamentals, along with economic factors and market psychology are already reflected in the stock price. Therefore, analysts study price movements only.
2. Repetitive price history: this means that price movements tend to repeat and their repetitive nature is assumed to be driven by market psychology. In other words, market participants tend to respond to market conditions in a similar way when such movements occur.
3. Price trends: this means that price movements generally follow trends. Once a trend is established, future price movements are more likely to consistent with the trend. In addition, most technical trading strategies are based on this assumption.
Technical analysis is not a prediction but a tool to help investors reduce risk and determine appropriate trading strategies.
***Disclaimer: This article has been compiled solely for informative and educational purposes. It is not intended to offer any recommendations or as investment advice. The Securities and Exchange Regulator of Cambodia (SERC) and Post Media Co Ltd are not liable for any losses or damages caused by using it in such a way.
Reference:
https://www.postkhmer.com/business/2022-04-04-1152-234384.html
https://www.bajajfinserv.in/what-is-technical-analysis
https://phsarhun.com/download/Overview%20of%20Cambodia%20Securities%20Market.pdf
https://csx.com.kh/en/education-publication/seminars-csx-training-/99